FEATURED INSIGHTS
Our professional ecosystem streamlines your JOURNEY BY partnering with industry leaders.

Recent analysis from The Australian Financial Review, drawing on data from research provider Cotality, highlights why sellers are in the box seat this spring. The combination of stronger borrowing capacity, real wage growth, and a restricted supply of homes is tipping conditions toward vendors. While the premium segment of the market remains more balanced, the entry-level and mid-range continue to see heightened competition.
The national Home Value Index is rising at 0.8% per month after a flat start to the year. Buyer demand has strengthened since July, largely because of falling interest rates and limited supply.
Takeaway: Tight supply is amplifying the impact of rate cuts, giving sellers greater pricing power.

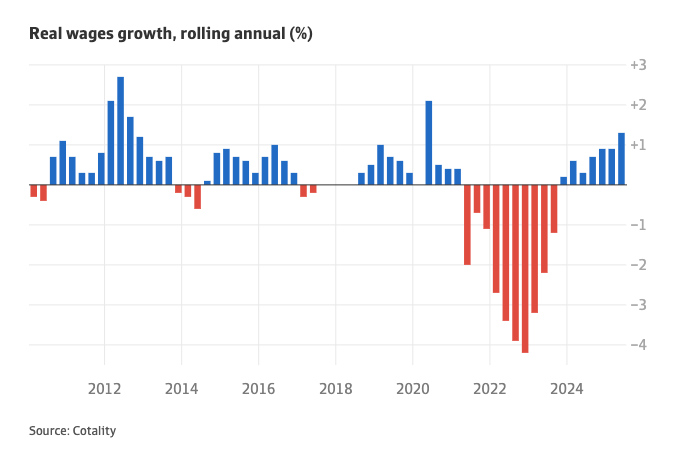
Real wages growth – wages adjusted for inflation – has climbed to 1.3%, its highest level in several years. This is the result of easing inflation and a tight labour market.
Takeaway: Higher disposable incomes translate into more borrowing capacity, which often flows into housing demand.
The estimated affordable purchase price for an entry-level home has risen from $520,000 to $560,000 since last year. Lower mortgage rates and wage growth are enabling buyers to stretch budgets. However, affordability pressures remain acute: a typical new loan now consumes 54% of disposable household income, the highest share in two decades.
Takeaway: First-home buyers face stress, but those already in the market can leverage larger deposits when trading up.

Auction clearance rates are averaging 69%, above the decade average of 64%. This reflects demand outpacing supply, particularly below the $2 million threshold.
Takeaway: High clearance rates signal competitive bidding, but mainly for mid- and lower-priced homes. Premium markets remain more balanced, with longer negotiations.

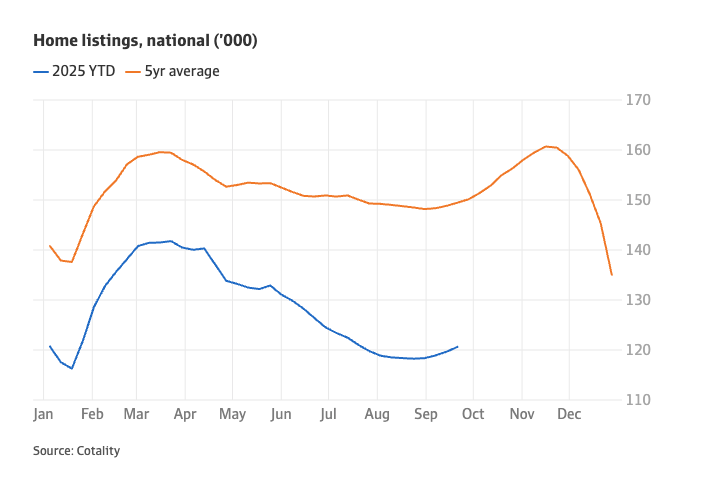
Currently, 121,000 properties are listed for sale nationally – about 20% below the five-year average. Although new listings are starting to tick up, supply remains subdued relative to demand.
Graph to include: Total listings vs. five-year average.
Takeaway: Limited stock continues to support sellers, even as more properties gradually come onto the market.
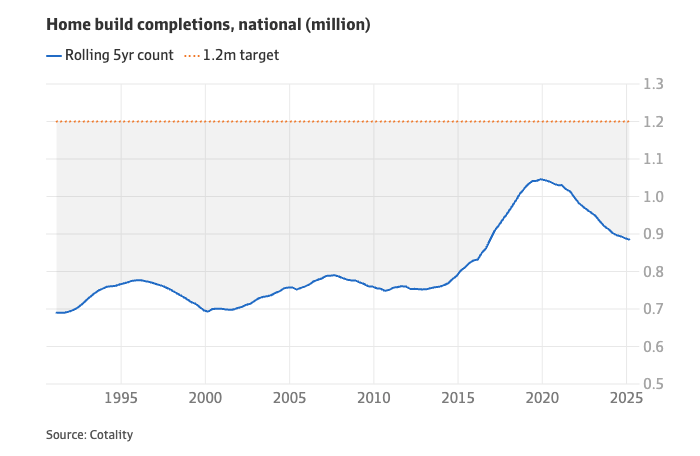
Dwelling completions are tracking well below the federal government’s target of 1.2 million new homes. Higher costs, labour shortages and financing challenges are restricting supply.
Takeaway: Structural supply shortfalls place a floor under values, reinforcing seller advantage in the medium term.
The current market reflects a classic seller’s advantage: stronger borrowing capacity and rising wages are colliding with tight supply and weak construction. However, conditions could shift quickly if interest rates fall further, listings increase significantly, or affordability pressures curb demand.
Key forward indicators to monitor:
Our professional ecosystem streamlines your JOURNEY BY partnering with industry leaders.

The Year To Invest - Are You Ready For 2025
14/1/25
Now is the perfect time to plan your next move

Commercial property Investing
1/8/24
Have you been considering investing in Commercial Property?

Addressing Australia's Housing Crisis through Sustainability and the Circular Economy
18/6/24
MONDAY - FRIDAY
Saturday


Acknowledgement of Country
GREENROCK®️ Advisory acknowledges the Traditional Owners of the lands on which we work.
We pay our respects to Elders past and present.
.png)
*Please note that Greenrock Advisory is not providing you financial advice. We offer you property investment advice and accounting services only and our affiliate partners assist with all financial planning and financial services.”
Copyright © 2023, All Rights Reserved. DESIGNED & Developed By ACMEmedia.com | Studionascent.com